News and Information
2023-05-21 15:18:40
It has been more than a month since the release of the 2019 new energy subsidy policy on March 26. According to data from the China Association of Automobile Manufacturers, the production and sales of new energy vehicles in China in April showed a month on month decline of over 10%. According to data from the China Automotive Power Battery Industry Innovation Alliance, the installed capacity of power batteries in China increased by 6.3% month on month in April. The changes in industry data can indirectly reflect that the production routes and strategic layouts of current automotive and power battery companies have gradually begun to diverge.
New energy vehicle companies are in the process of "destocking" in the first quarter, and the transition period of "rush to install" may end prematurely due to its impact
On the 13th, the China Association of Automobile Manufacturers released data on the production and sales of new energy vehicles in April, with production reaching 102000 units, a decrease of 11.9% compared to the previous month, and sales reaching 97000 units, a decrease of 14.8% compared to the previous month
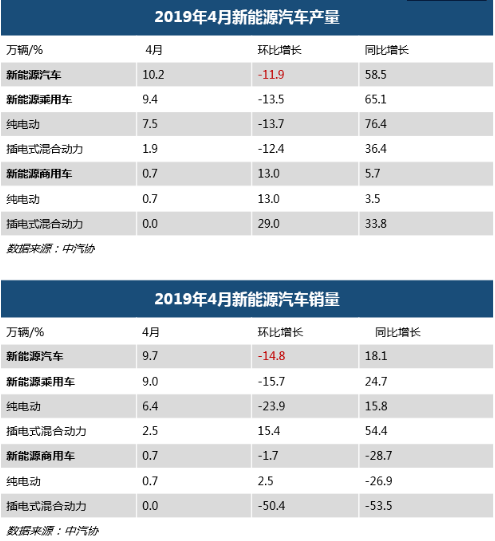
In the first month after the release of new energy subsidies, there was a simultaneous decline in production and sales volume. Compared to 2018, the time for new energy vehicles to rush to install has already advanced. According to car companies telling SMM, due to the industry's pessimism about the extent of subsidy policy reduction in 2019 since last year, and the expectation that the new energy subsidy policy would be released at the beginning of the year, the behavior of car companies rushing to install began at the end of last year.

The 2018 new energy subsidy policy was released on February 13th of that year, and the transition period lasted until June 11th. From the above figure, it can be seen that after the subsidy was issued in 2018, the "rush to install" behavior showed significant performance in April and May, with sales exceeding production. The year-on-year growth rate began to decline from April, and after the subsidy transition period ended, production and sales steadily increased again.
In December, due to the industry's experience in dealing with significant subsidy reductions at that time, car companies with good cash flow began to "rush to install" since December. From a data perspective, the "rush to install" period in 2019 has advanced by nearly four months, and the year-on-year growth rate has also started to decline since March. The impact of the "rush to install" in 2019 may end earlier.
Due to the large-scale production and "rush installation" of new energy vehicles by car companies in December last year, "destocking" has become a key task for many car companies in the first quarter of this year.
The following figure shows the production and sales volume of BAIC New Energy in the past five months.
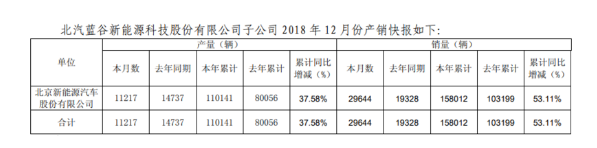
In 2018, BAIC New Energy produced a total of 110000 new energy vehicles, an increase of 37.58% year-on-year. At the same time, sales of 158000 vehicles were achieved, an increase of 53.11% year-on-year.
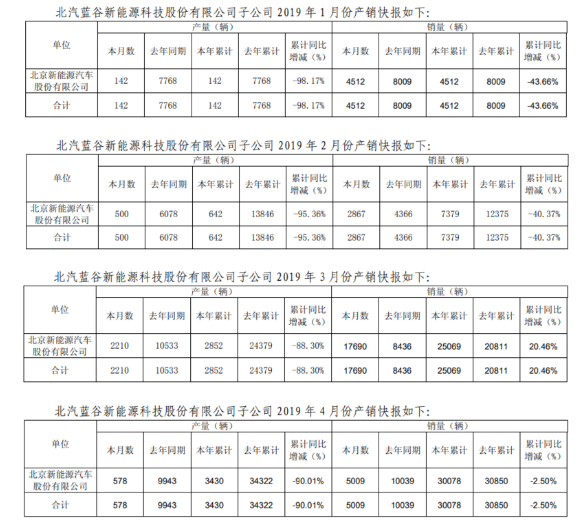
After entering 2019, the production in January, February, and April only achieved production in units of hundreds, with a year-on-year decline of about 90%. Although the production in March exceeded four digits, the year-on-year decline also reached 79%. From the above data, it can be observed that BAIC New Energy's destocking process continued until the second quarter of this year.
For host manufacturers, the current subsidy policy for new energy is still the main factor affecting the market. On the one hand, it is necessary to cooperate with battery suppliers to obtain more subsidies as much as possible, and on the other hand, it is also necessary to prepare in advance for the post subsidy era based on cost and market positioning.
The market share of various types of batteries is stabilizing, and the power battery industry is entering a reshuffle countdown
According to the data from the China Automotive Power Battery Industry Innovation Alliance, the installed capacity of power batteries in China reached 17.7 GWh from January to April 2019. The installed capacity of ternary batteries is 13GWh, accounting for 73.2%; The installed capacity of lithium iron phosphate batteries is 4.32GWh, accounting for 24.4%, the installed capacity of lithium manganese oxide batteries is 0.09GWh, accounting for 0.5%, and the installed capacity of lithium titanium oxide batteries is 0.2GWh, accounting for 1.1%.
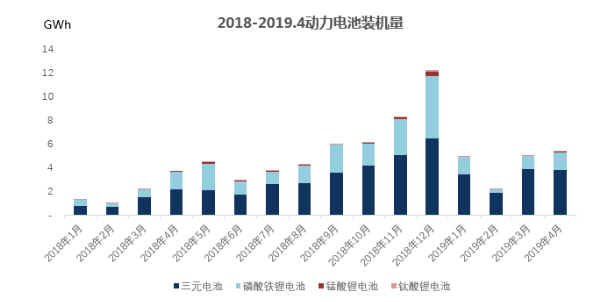
In 2018, the proportion of ternary batteries and lithium iron phosphate installed in the new energy vehicle industry fluctuated around 6:4. Among them, the installed capacity of lithium iron phosphate batteries exceeded that of ternary batteries for the first time in May 2018. In addition, the proportion of installed capacity of lithium iron phosphate batteries also increased significantly in December 2018. Observing the month when the installed capacity of lithium iron phosphate batteries has significantly increased, we found that the installed capacity of EV buses in that month has shown a month on month increase. The excellent safety performance and cost advantages make lithium iron phosphate batteries the main installed battery type in the bus market, and the single vehicle power of EV buses is usually 4-5 times that of EV passenger cars. This also makes the changes in the bus market have a significant impact on the market share of various types of batteries.
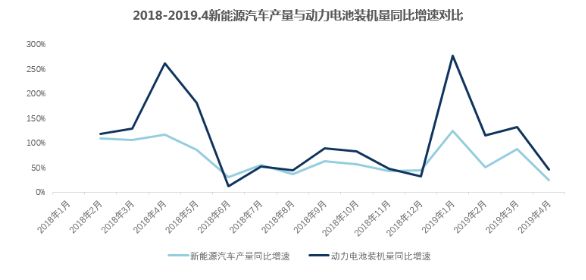
From the comparison chart of the year-on-year growth rate between the production of new energy vehicles and the installed capacity of power batteries, it can be seen more clearly that the installed capacity of power batteries has always maintained a growth rate above the production of new energy vehicles. The peak in 2018 occurred in April May, while in 2019 it appeared in January. The time points are all during the 'rush to install' period. Compared to passenger cars, the bus market is more affected by new energy subsidy policies, and bicycles receive more subsidies, which also leads to a peak in bus sales during the "rush to install" period.
In addition, the 2018 new energy subsidy policy has raised the requirements for energy density to a higher level, and the overall electricity consumption of the industry is constantly increasing. This is also one of the reasons why the growth rate curve of installed power batteries mostly exists above the growth rate of new energy vehicle production.
On March 26, 2019, four ministries jointly issued a notice on further improving the financial subsidy policy for the promotion and application of new energy vehicles. The subsidy policy will be implemented from March 26 and the transition period will end on June 25.
On May 8th, four ministries jointly issued a notice on supporting the promotion and application of new energy buses. Although the technical indicators are still implemented according to the new energy subsidy policy, the transition period is set from May 8th to August 7th, 2019. We can expect that there will still be a "rush to install" situation in the new energy bus market in the future, and there is a growth space of about 30% for lithium iron phosphate batteries. However, considering that the domestic bus market is close to saturation, with more demand for replacement, and the development of fuel cells is also proceeding as scheduled, the overall new energy vehicle market is expected to still be dominated by the use of ternary batteries this year, and the proportion of various types of batteries will tend to stabilize.
Let's take a look at the current market competition landscape of power batteries. The following chart shows the cumulative installed capacity ranking of power battery companies from January to April 2019.
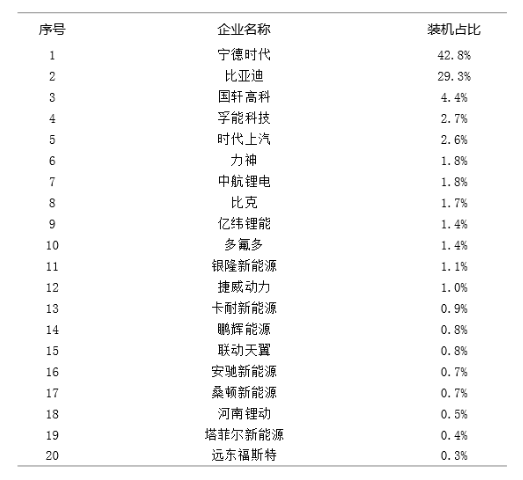
In the first four months, the installed capacity of CATL and BYD accounted for 72.1% of the entire power market, and with the addition of SAIC, the total market share can reach 74.7%. In 2018, this number was still 61.5%.
Previous Page